Donate Tickets

Pre-Show Genogram and Genre Activity

A woman is looking straight at the camera. Behind her, a man in a white suit looks off-camera. The background is blurry, and there is a light source above the two people.
Aeriel Williams and Kelvin Roston Jr. by Joe Mazza.

The Gospel at Colonus is a fresh reimagination of a Greek play, using music as a powerful storytelling tool. The songs in Gospel serve to drive the plot, access powerful emotions, and bring the audience on a rich journey of conflict, grief, and redemption. These songs help us understand the complex experiences of Oedipus and his family. In this pre-show activity, we invite you to consider the intersection of music and the story of your own family lineage.

Though intended as a pair, the following two sections may be completed separately as desired. 

Genogram Activity

  • Activity Preparation
    • Supplies
      • Paper and writing utensils of multiple colors, or digital art-making tools (like Canva or a Jamboard). 

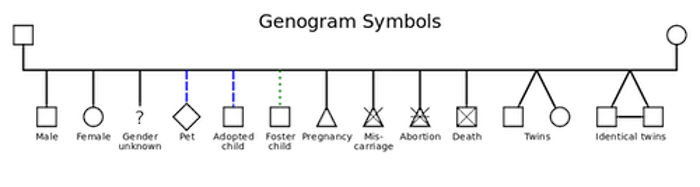
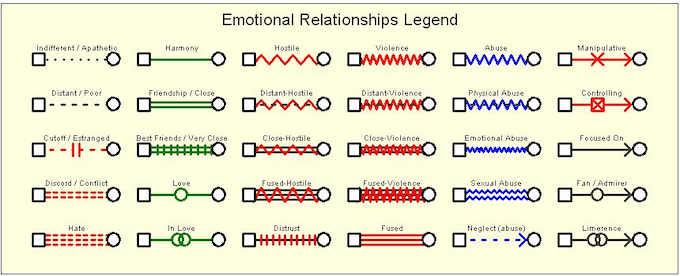
A genogram is a kind of family tree that enables you to get specific about events, relationships, and challenges that have appeared in the branches of your family. Below, you will see two examples of genogram keys: one depicting family members and life events, the other depicting relationships.

A chart of genogram symbols. A square represents a male. A circle represents a female. A question mark represents a person with an unknown gender. A blue dashed line connected to a diamond represents a pet. A blue dashed line connected to a square represents an adopted child. A green dotted line connected to a square represents a foster child. A triangle represents a pregnancy. A triangle with an "x" through it represents a miscarriage. A triangle with an "x" through it and a horizontal through the "x" represents an abortion. A square with an "x" through it represents a death. Two diagonal lines forming an upside down "v" connecting to shapes representing individuals means twins; two diagonal lines connecting to shapes representing individuals, with a third line connecting the individuals, represents identical twins.
Genogram symbols key courtesy of Wikipedia.
An emotional relationships key for a genogram. A dotted line connecting individuals means they are indifferent/apathetic. A dashed lines means the relationship is distant/poor. A red dashed line with two vertical lines in the middle respresents a relationship that has been cut off or is estranged. Two parallel red dashed lines connecting individuals represents discord/conflict. Three parallel dashed lines connecting individuals means the relationship is hateful. A single green line between individuals represents harmony. Two parallel green lines between individuals represents friendship/a close relationship. Two parallel green lines with a series of vertical lines running across (as if a train track) represent best friends and a very close relationship. A green line between two individuals with a green open circle in the center represents a love relationship. A green line between two individuals with two intersecting circles in the center represents two people who are in love. A red jagged line between individuals represents a hostile relationship. A red jagged line between individuals with a solid black line running in the middle represents a relationship that is distant/hostile. A red jagged line between individuals with two solid black lines running in the middle represents a relationship that is close-hostile. A red jagged line between individuals with three solid black lines running in the middle represents a relationship that is fused-hostile. A single black line between individuals with red lines running vertically across represents a distrustful relationship. A red squiggle connecting individuals represents a violent relationship. A red squiggle with a single black line running horizontally between two individuals represents a distant-violent relationship. A red squiggle with two black lines running horizontally between two individuals represents a close-violent relationship. A red squiggle with three black lines running horizontally between two individuals represents a fused-violent relationship. Three horizontal red lines connecting individuals represents a fused relationship. A blue squiggle connecting individuals represents an abusive relationship. A blue squiggle with a black horizontal line connecting individuals represents a physically abusive relationship. A tight blue squiggle connecting individuals represents an emotionally abusive relationship. Two tight blue squiggles connecting individuals represents a sexually abusive relationship. A blue dotted arrow between two individuals represents an abusive/neglectful relationship. A red arrow with an "x" in the middle pointing from one individual to another represents a manipulative relationship. A red arrow with an "x" in a square in the middle pointing from one individual to another represents a controlling relationship. A black arrow pointing from one individual to another represents a relationship where one person is focused on the other. A black arrow with an open circle in the middle, pointing from one individual to another, represents one person being a fan/admirer of the other. A black arrow with overlapping open circles in the middle, pointing from one individual to another, represents one person in limerance.
Emotional relationships key courtesy of Wikipedia.

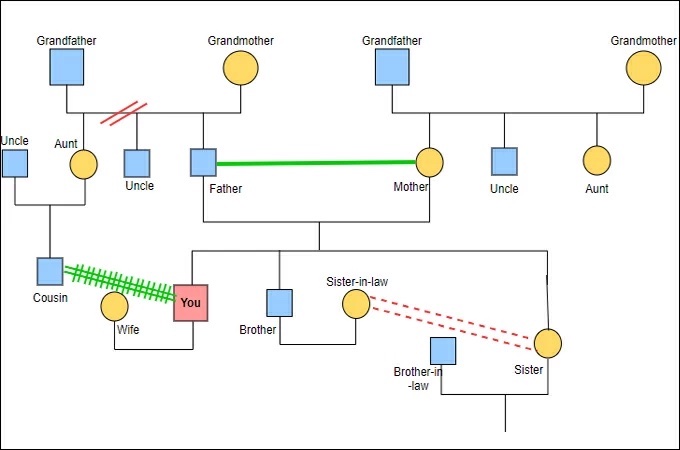
Here is an example of a completed genogram. Using the keys above, you can trace the various family members and their relationships to one another.

A sample genogram with people represented by shapes, with lines connecting them according to their relationships.
Genogram courtesy of GitMind.

This Wikipedia page has some helpful keys to use; however, you should feel free to create your own! After you craft your key, begin making your genogram. Consider these questions as you work:

  • Is there a particular generation or part of your family tree you would like to focus on? 
  • Are there any family members you can talk with to learn more about the relationships and experiences in your family tree? 
  • In many ways genograms encourage us to think about trauma and challenges within a family system. What positive experiences might you want to highlight between people on your genogram? 
  • Genograms were invented in the mid-1980s. Our understanding of things like gender and relationships has evolved since. In what ways might your own genogram reflect the way you understand and think about gender, relationships, and family structures? 
  • What shared or distinct identities might you wish to explore or highlight in your genogram? How will you indicate these? 
  • Where does your genealogy have missing pieces? 
  • How might you reflect both blood family and chosen family with your genogram? 

Depending on your approach, your genogram will likely look much more layered than a typical family tree. Consider whether you’d like to engage in a few iterations of this step to explore various elements of your family tree! 

Genre Activity

  • Activity Preparation
    • Supplies
      • Preferred music app, paper and writing utensils, or your genogram

What music would soundtrack the life of you or your family tree? Create a playlist. You may choose to use your preferred music app, write your songs on paper, or even add them to your genogram.

As you craft your playlist, consider these questions: 

  • Will your playlist reflect a particular branch of your family? Will it reflect a certain family member’s life and experiences? Will you select one song for each family member you are considering? Will you select a certain span of time to illustrate musically? 
  • What influence would you like eras to play in your musical selections? (For example, if you are selecting a song related to someone who was alive during the 1960s, do you want to pick music from that decade? Or, would you like to select a song that reflects their life and relationships lyrically?) 
  • Are there any future generations you would like to soundtrack? What might those sound like? 
  • Is there an overall mood or tone that would you like to strike with your playlist? 

You may also choose to complete this same activity using visual art or colors. Create a family tree mood board on your preferred platform! 


  • This activity aligns with the following standards:
    • Illinois Arts Learning Standards 
      • Anchor Standard 1: Generate and conceptualize artistic ideas and work.
      • Anchor Standard 2: Organize and develop artistic ideas and work.
      • Anchor Standard 10: Synthesize and relate knowledge and personal experiences to make art.
      • Anchor Standard 11: Relate artistic ideas and works with societal, cultural, and historical context to deepen understanding.
    • Common Core State Standards 
      • CCSS.ELA.R.3 Analyze how and why individuals, events, or ideas develop and interact over the course of a text.
      • CCSS.ELA.R.5 Analyze the structure of texts, including how specific sentences, paragraphs, and larger portions of the text (e.g., a section, chapter, scene, or stanza) relate to each other and the whole.
      • CCSS.ELA.R.6 Assess how point of view or purpose shapes the content and style of a text.

Posted on May 9, 2023 in Learning Guides, Productions

You have seat(s) on hold for:
20:00

Cancel

Forgot your password?